The constancy of change and the new catastrophism: a personal reflection on crisis-driven science.
In 2010, we published what is now a best-selling (and award-winning) book Canada Rocks-The Geologic Journey aimed at telling the dramatic story for a public audience of how Canada (and North America) has evolved over the last 4 billion years. It was a milestone in our professional and personal lives as we went on many field trips to fill in gaps in our own understanding and in the process stepped well beyond our own areas of expertise. We learned much about this fantastic country and its geology.
What is patently obvious from reviewing Canada’s ancient history is that scientists still do not have an adequate understanding of Earth’s complex systems on which to base sound economic and environmental policy. From the upper reaches of the atmosphere to the depths of the oceans onwards to the deep interior of the planet our knowledge of complex earth systems is still rather rudimentary. Huge areas of our planet are inaccessible and are little known scientifically. There is still also much to learn from reading the rock record of how our planet functioned in the past.
In so many areas, we simply don’t know enough of how our planet functions.
And yet……
Scarcely a day goes past without some group declaring the next global environmental crisis; we seemingly stagger from one widely proclaimed crisis to another each one (so we are told) with the potential to severely curtail or extinguish civilization as we know it. It’s an all too familiar story often told by scientists who cross over into advocacy and often with the scarcely-hidden sub-text that they are the only ones with the messianic foresight to see the problem and create a solution. Much of our science is what we would call ‘crisis-driven’ where funding, politics and the media are all intertwined and inseparable generating a corrupting and highly corrosive influence on the scientific method and its students. If it doesn’t bleed it doesn’t lead is the new yardstick with which to measure the overall significance of research.
Charles Darwin ushered in a new era of thinking where change was expected and necessary. Our species as are all others, is the product of ongoing environmental change and adaption to varying conditions; the constancy of change. In the last 15 years or so however, we have seemingly reverted to a pre-Darwinian mode of a fixed ‘immutable Earth’ where any change beyond some sort of ‘norm’ is seen in some quarters as unnatural, threatening and due to our activities, usually with the proviso of needing ‘to act now to save the planet.’ Honest scientific discourse and debate is often rendered impossible in the face of the ‘new catastrophism.’
Trained as geologists in the knowledge of Earth’s immensely long and complex history we appreciate that environmental change is normal. For example, rivers and coastlines are not static. Those coasts, in particular, that consist of sandy strand-plains and barrier-lagoon systems are continually evolving as sand is moved by the waves and tides. Cyclonic storms (hurricanes), a normal component of the weather in many parts of the world, are particularly likely to cause severe erosion. When recent events such as Hurricanes Katrina and Sandy cause catastrophic damage, and spring storms cause massive flooding in Calgary or down the Mississippi valley, and droughts and wildfires affect large areas of the American SW these events are blamed on a supposed increase in the severity of extreme weather events brought about by climate change. In fact, they just reflect the working of statistical probability and long term climate cyclicity. Such events have happened in the past as part of ongoing changes in climate but affected fewer people. That the costs of weather and climate-related damage today are far greater is not because of an increased frequency of severe weather but the result of humans insisting on congregating and living in places that, while attractive, such as floodplains, mountain sides and beautiful coastlines, are especially vulnerable to natural disasters. Promises of a more ‘stable future’ if we can only prevent climate change are hopelessly misguided and raise unnatural expectations by being willfully ignorant of the natural workings of the planet. Climate change is the major issue for which more geological input dealing with the history of past climates would contribute to a deeper understanding of the nature of change and what we might expect in the future. The past climate record suggests in fact that for much of the Earth’s surface future cooling is the norm. Without natural climate change Canada would be buried under ice 3 km thick; that is it normal state for most of the last 2.5 million years with 100,000 years-long ice ages alternating with brief, short-lived interglacials such as the present which is close to its end.
It is self-evident to us that the public debate concerning environmental change largely lacks an understanding of natural variability. Since the last Ice Age ended, some 12,000 years ago, Earth has been through several periods lasting hundreds of years and possibly longer when it was either warmer or colder than at present. Several earth scientists have suggested that a study of natural variability over recent geologic time should be completed in order to provide a baseline against which anthropogenic change may be evaluated, but this important history has not been introduced fully into the public debate, and is a long way off. It has to be said that the natural variability of the last few thousand years or hundreds of years or tens of years has formed almost no part in the ongoing discussion of climate change which in some circles assumes that any change since 1940 is largely man-made. This opinion is uninformed by geologic science.
The way forward it strikes us is for more scientific honesty and less politics, less grandstanding. ‘We don’t know’ is an honourable credo for scientists. In this regard, we need more science to be directed to the environment, particularly toward better planning of the world’s communities to make them more resilient in the face of change. And it is an increasingly urban face that our planet presents. The many large supercities of the rapidly-approaching future world will be absolutely massive consumers of resources and producers of wastes; they will be the biggest determinants of our global environmental footprint; and it is surely there that much of our effort should be spent. Today, the rate of change of some parts of the world, especially in regard to urbanization and the ‘rush to the city’ is taxing our abilities simply to map and assess the environmental repercussions of transforming a natural environment to a built landscape. There is no simple technological fix either. Satellite and other monitoring data for example still has to be collected, interpreted, ground truthed, and acted on; steps available only to wealthier countries. In large areas of the planet the lack of human and financial resources, equality and personal freedoms and political choices trump any global environmental concerns and hobble international co-operation. To these people our obsession with saving the environment must ring hollow. The onus here is on the wealthiest nations with the largest scientific academies to put forward credible notions of how our planet is changing and to discuss the possible origins in an intellectual environment where data gaps are fully acknowledged free of catastrophic overtones.
Poles apart: A record-breaking summer and winter
The sun has set over the central Arctic Ocean and sea ice extent is
now increasing. While much attention has been paid to the record minimum
Arctic ice extent set on September 16, 2012,
winter sea ice extent in Antarctica has reached a record high. The
Antarctic extent increase is an interesting response to changes in
circulation patterns in the Southern Hemisphere.
A view towards the south
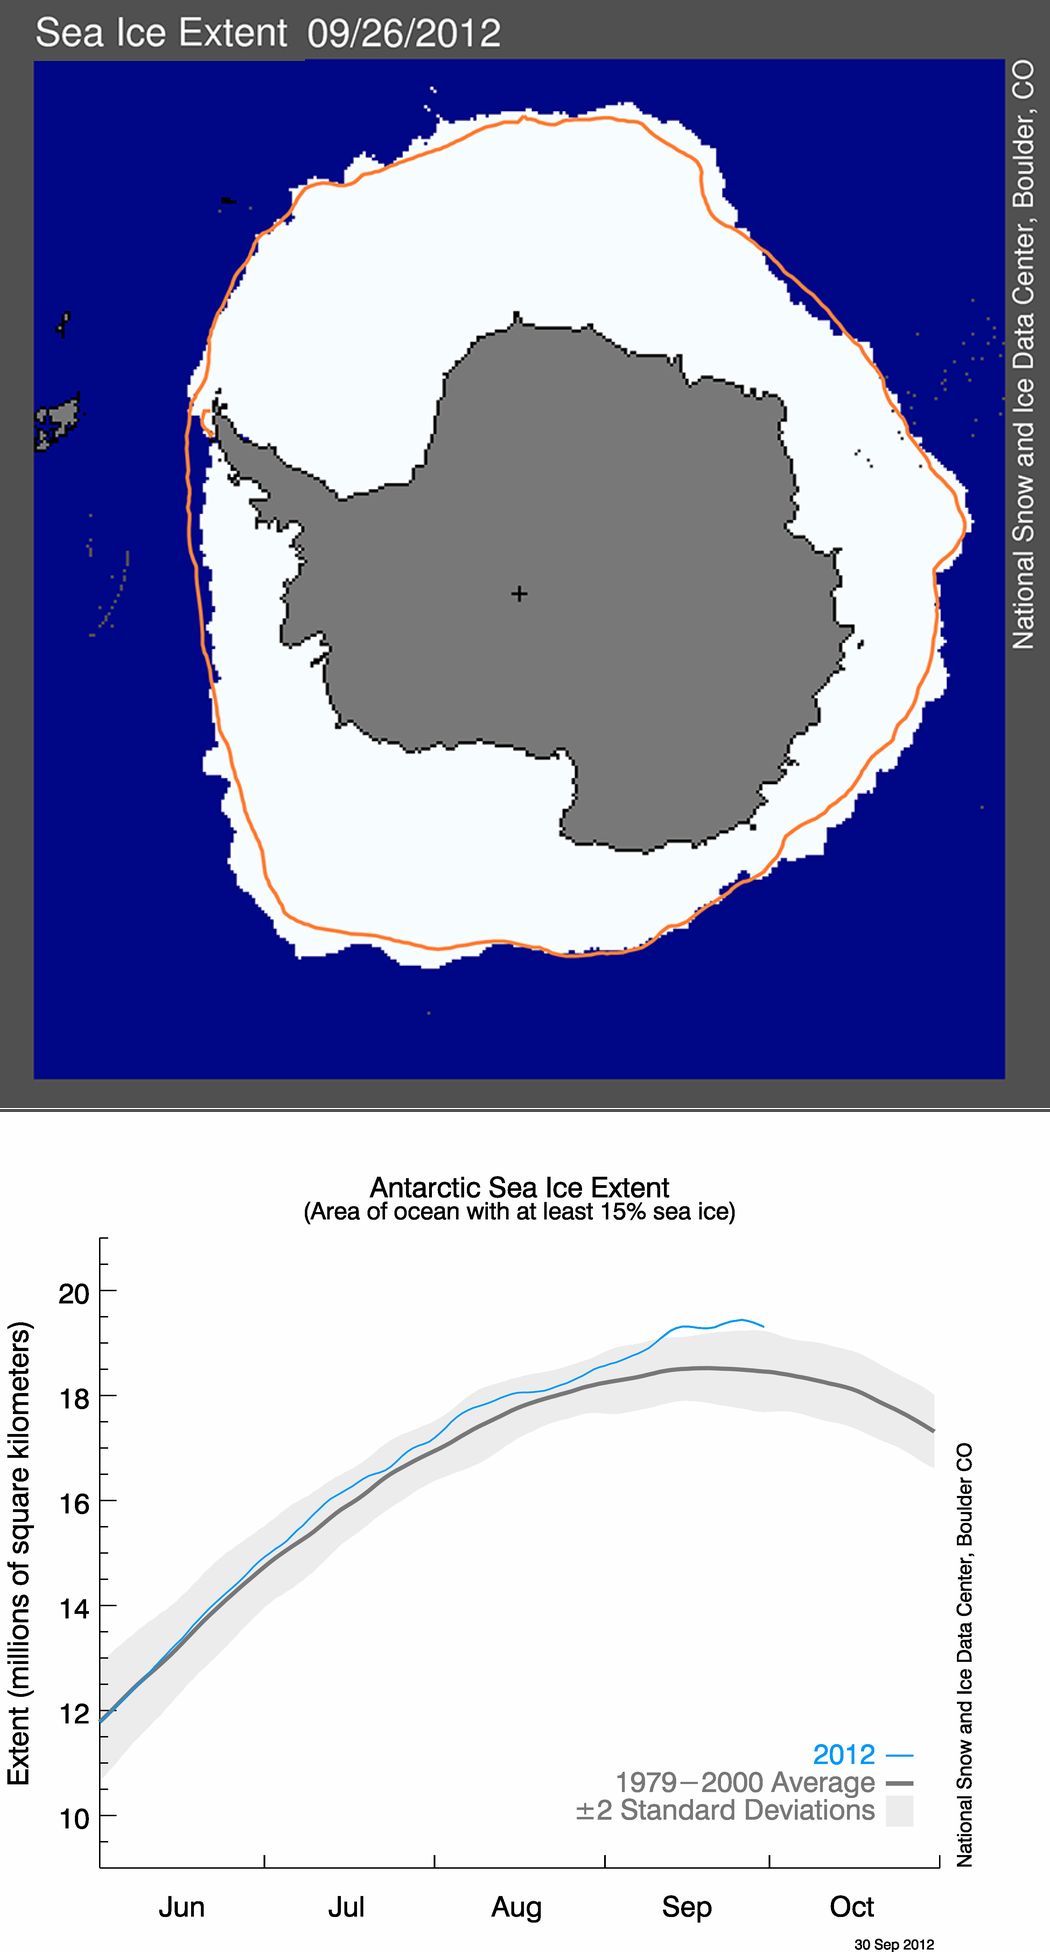
Figure
6a. Antarctic sea ice extent for September 26, 2012 (top image) was
19.44 million square kilometers (7.51 million square miles). The orange
line shows the 1979 to 2000 median extent for that day of the year. The
black cross indicates the geographic South Pole. The graph (bottom)
shows Antarctic sea ice extent as of September 30, 2012. The 1979 to
2000 average is in dark gray. The gray area around this average line
shows the two standard deviation range of the data. Sea Ice Index data.
Credit: National Snow and Ice Data Center
High-resolution image
Credit: National Snow and Ice Data Center
High-resolution image
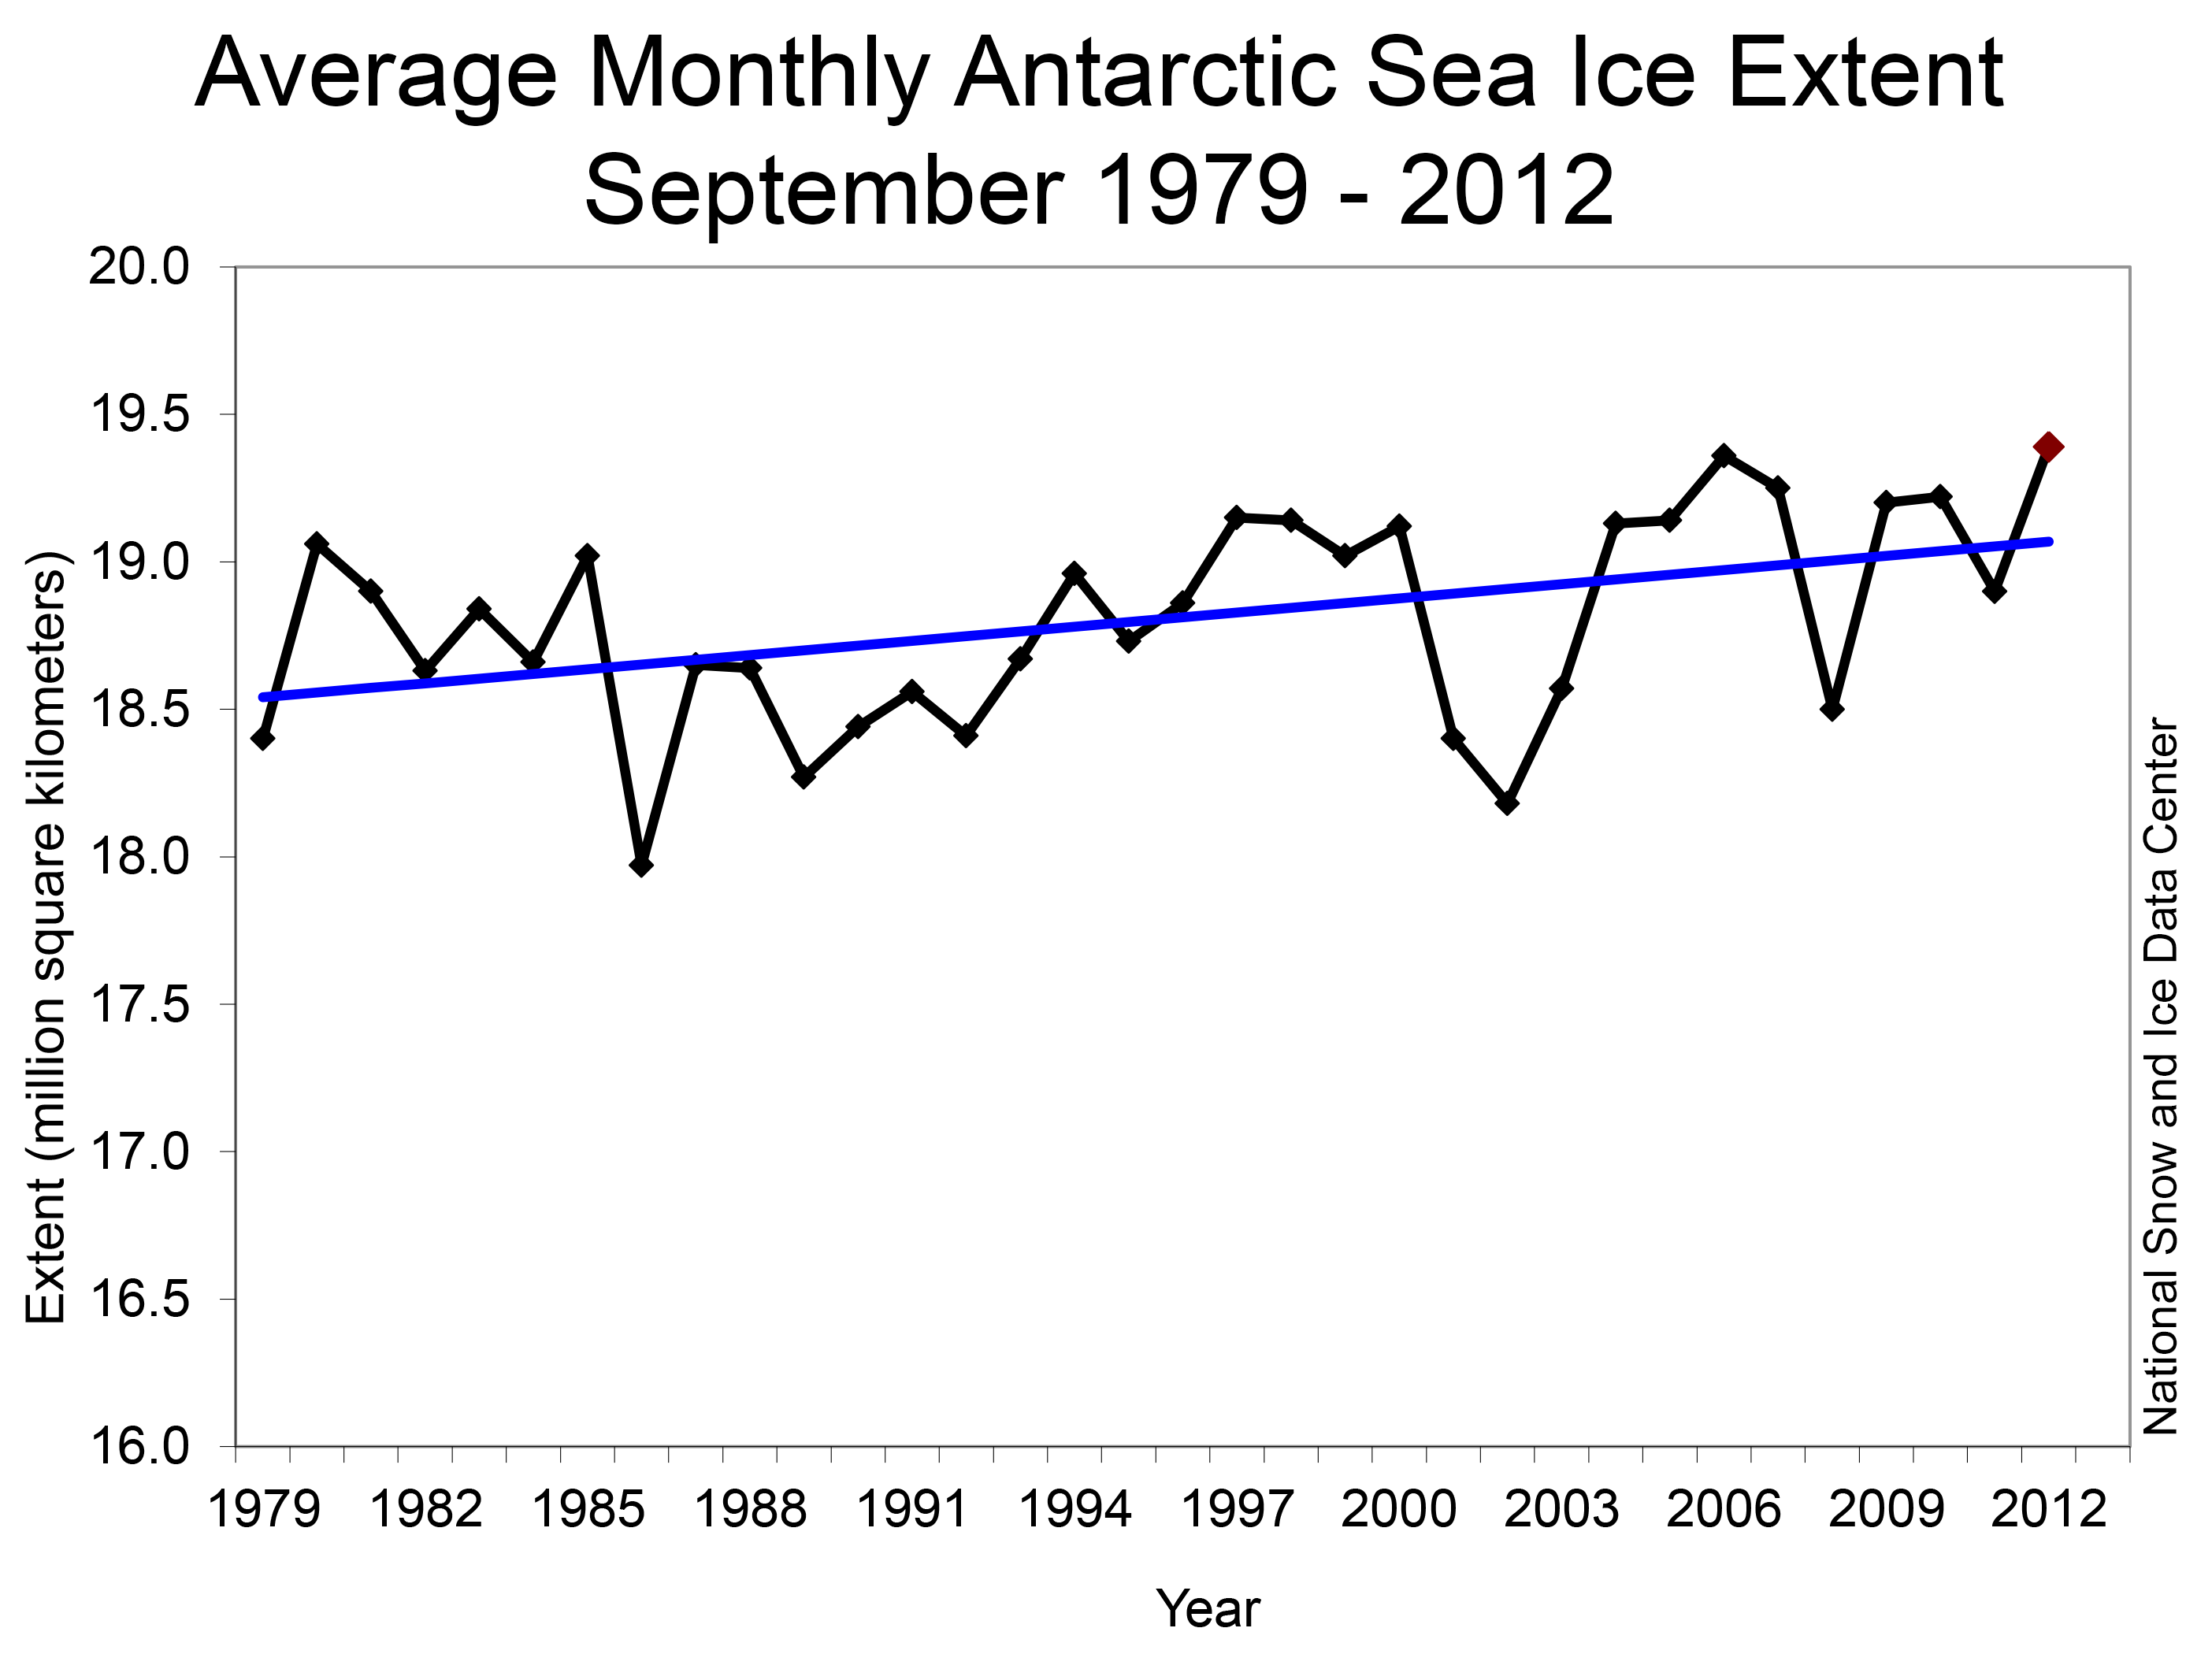
Figure 6b. The monthly September Antarctic extent trend for 1979 to 2012 is +0.9% per decade.
Credit: National Snow and Ice Data Center
High-resolution image
Credit: National Snow and Ice Data Center
High-resolution image
The September extent trend for 1979 to 2012 is just above the statistical significance level (0.9% per decade, plus or minus 0.6%). The new Antarctic sea ice September value is slightly greater than typical year-to-year variations, and is roughly equal to a 25 mile (40 kilometer) northward shift in the location of the ice edge relative to the 1979 to 2000 average. The trend for ice extent growth during Antarctic winters is about 16,000 square kilometers per year (6,200 square miles) or roughly an area the size of Connecticut. In comparison, the decline in Arctic summer sea ice extent is an area about the size of Indiana (91,600 square kilometers per year, or about 35,400 square miles).
Our colleague, Dr. Sharon Stammerjohn of INSTAAR, University of Colorado, provides a review of the differences between Arctic and Antarctic climate controls on sea ice and helps place the events in context. First, climate is warming over much of the Antarctic continent, as shown in several recent studies (e.g., Chapman and Walsh, 2007, Monaghan et al., 2008, Steig et al., 2009) and is related to Pacific Ocean warming (Ding et al., 2010) and circumpolar winds. Both warming and ozone loss act to strengthen the circumpolar winds in the south. This is due primarily to persistently cold conditions prevailing on Antarctica year-round, and a cold stratosphere above Antarctica due to the ozone hole. Stronger winds generally act to blow the sea ice outward, slightly increasing the extent, except in the Antarctic Peninsula region, where due to geography, winds from the north have also increased, pushing the ice southward. Thus, sea ice extent near the northwestern Antarctic Peninsula continues to decline rapidly, while areas in the Ross Sea and the southern Indian Ocean show significant increases (Stammerjohn et al., 2012). Circumpolar-averaged sea ice extent changes nearly cancel each other out for all months of the year (Parkinson and Cavalieri, 2012). This winter, atmospheric conditions were near average overall, with roughly equal areas of cooler and warmer air temperatures over the sea ice.
Comparing winter and summer sea ice trends for the two poles is problematic since different processes are in effect. During summer, surface melt and ice-albedo feedbacks are in effect; winter processes include snowfall on the sea ice, and wind. Small changes in winter extent may be a more mixed signal than the loss of summer sea ice extent. An expansion of winter Antarctic ice could be due to cooling, winds, or snowfall, whereas Arctic summer sea ice decline is more closely linked to decadal climate warming.
For more information on Antarctic climate and sea ice, see NSIDC’s Icelights, our Sea Ice Index, and our State of the Cryosphere Web sites. The NASA Goddard Ozone Watch site also provides additional background information.
Table 1: Previous Arctic sea ice extents for the month of September
| Year | Average Arctic Sea Ice Extent for September | Trend, in % per decade (relative to 1979-2000 avg.) | |
|---|---|---|---|
| in millions of square kilometers | in millions of square miles | ||
| 2007 | 4.30 | 1.66 | -10.2 |
| 2008 | 4.73 | 1.83 | -11.0 |
| 2009 | 5.36 | 2.08 | -11.1 |
| 2010 | 4.90 | 1.90 | -11.5 |
| 2011 | 4.61 | 1.78 | -12.0 |
| 2012 | 3.61 | 1.39 | -13.0 |
| 1979 to 2000 average | 7.04 | 2.72 | |
| 1979 to 2010 average | 6.52 | 2.52 | |
References
Parkinson, C., and D. Cavalieri. 2012. Antarctic sea ice variability and trends. The Cryosphere 6, 871-880, doi:10.5194/tc-6-871-2012.Stammerjohn, S., R. Massom, D. Rind, and D. Martinson. 2012. Regions of rapid sea ice change: an inter-hemispheric seasonal comparison. Geophysical Research Letters 39, L06501, doi:10.1029/2012GL050874.
Ding, Q., E. Steig, D. Battisi, and M. Kuttel. 2011. Winter warming in West Antarctica caused by central tropical Pacific warming. Nature Geoscience 4, doi:10.1038/ngeo1129.
Steig, E., D. P. Schneider, S. D. Rutherford, M. Mann, J. C. Comiso, and D. T. Shindell. 2009. Warming of the Antarctic ice-sheet surface since the 1957 International Geophysical Year. Nature 457, 459-462, doi:10.1038/nature07669.
Monaghan, A. J., D. H. Bromwich, W. Chapman, and J. Comiso. 2008. Recent variability and trends of Antarctic near-surface temperature. Journal of Geophysical Research 113, D04105, doi:10.1029/2007JD009094.
Chapman, W. L., and J. E. Walsh. 2007. A synthesis of Antarctic temperatures. Journal of Climate 20 (16), 4096-4117, doi:10.1175/JCLI4236.1.
No comments:
Post a Comment